Introduction
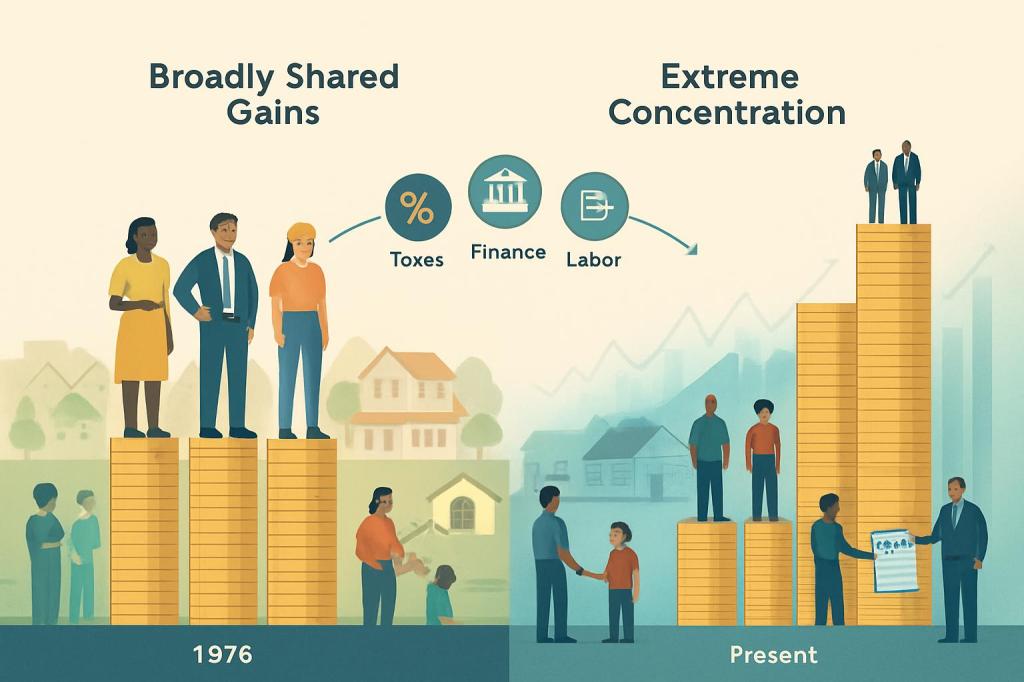
Since the mid‑1970s, the United States has moved from an era of broadly shared gains to one defined by extraordinary wealth concentration at the top. This report traces that transformation across four dimensions. First, it reassesses long‑run evidence on top wealth shares and explains why newer data and methods now converge on a steep rise in concentration. Second, it links post‑1976 policy shifts—tax, financial, labor, and credit—to the acceleration of wealth at the very top. Third, it examines how racialized housing markets and unequal intergenerational transfers have locked in large racial wealth gaps. Finally, it shows how asset booms, busts, and leverage patterns have reshaped balance sheets, amplifying the divide between elites and everyone else.
Across diverse data sources and methods, a consistent picture emerges: since the mid‑1970s, and especially from the 1980s onward, U.S. wealth has become markedly more concentrated at the top, with gains heavily skewed toward a tiny slice of households and stratified sharply by race.
The scale and timing of rising concentration vary by methodology, but the direction is unambiguous. Survey-based Federal Reserve data (Survey of Consumer Finances and Distributional Financial Accounts) show the top 1% wealth share increasing from roughly 25–30% in the late 1980s to about 31–37% by 2019–24, while the bottom 50% has slid from about 3–4% of total wealth to roughly 2–2.5% over the same period [1][2][3][4]. Tax-based “capitalization” methods, which infer wealth from capital income reported on tax returns, typically find even higher levels and steeper increases in top shares, particularly for the top 0.1% and 0.01% [2][3][5]. Once recent revisions to national accounts, real estate valuations, and mortality assumptions are incorporated, these approaches converge: by around 2016–2024, both surveys and capitalization estimates place the top 1% share near 40% of total household wealth, up from roughly 25–30% in the 1980s [1][2][5].
At the very top, the rise has been especially dramatic. The wealth share of the top 0.01% has roughly quadrupled over the last 35 years, and Forbes-based estimates show the 400 richest Americans (about the top 0.00025%) also multiplying their share since the early 1980s [2][3]. Between 1979 and 2007, incomes of the top 1% grew by about 275%, laying a powerful income base for subsequent wealth accumulation [1]. Even in periods when aggregate measures of wealth concentration appear relatively flat—such as parts of the 1980s and 1990s—disaggregated income data show that nearly a third of all real income growth from 1982 to 2003 accrued to the top 1%, and roughly 80% to the top fifth of households, leaving the bottom 80% with only 20% of gains [3]. This pattern underscores how macroeconomic growth has been systematically converted into higher wealth at the top through ownership of equity, closely held businesses, and retained earnings.
Methodological debates have softened over time as data improve. Earlier estate-multiplier approaches tended to understate top wealth shares because they did not account for widening mortality gaps by wealth; wealthier households now live significantly longer than average, reducing the frequency of large taxable estates [3][5]. Updated capitalization models that better incorporate pensions, housing, and asset-specific rates of return, and that anchor more tightly to revised national accounts, now line up more closely with Federal Reserve survey data [1][2]. The remaining disputes center less on whether inequality has risen and more on how to precisely time and decompose the increase across the top 1%, 0.1%, and 0.01%.
The underlying drivers of these trends lie in policy shifts and changing asset dynamics rather than in broad-based overborrowing at the bottom. Since the late 1970s, major tax reforms have cut top marginal income tax rates and reduced or preferentially taxed capital gains and dividends, directly boosting after-tax returns for those with substantial capital [1][3]. Financial deregulation expanded access to credit and sophisticated financial instruments, disproportionately benefiting already-wealthy households positioned to invest in corporate equity and private businesses. At the same time, labor-market institutions weakened: union coverage fell, minimum wages eroded in real terms, and bargaining power for middle- and lower-wage workers declined, channeling a growing share of national income away from labor and toward capital [1][3]. Together, these institutional changes amplified preexisting advantages at the top and constrained asset-building among the bottom 90%.
Balance-sheet evidence clarifies how these macro forces translate into distributional outcomes. Detailed decompositions show that the top 1% and next 9% have vastly expanded their holdings of corporate equity and business assets, while the middle 50–90% saw their wealth share fall and the bottom 50% remained effectively asset-poor [2]. Real estate and pensions, which are more widely held, contribute comparatively little to the widening gap; by contrast, stock ownership and business equity—highly concentrated at the top—are central to rising inequality [1][2]. From 1989 onward, the bottom half of households saw essentially no net wealth growth, while the top 1% experienced nearly a 300% increase in wealth, with divergence accelerating around 2000 as equity markets boomed and ownership concentration intensified [1][4].
Asset composition and leverage patterns also determine who gains from booms and who is exposed in downturns. Middle- and lower-middle-class households concentrate wealth in owner-occupied housing and often rely on high leverage to access it. Research following households from 1983 to 2013 shows that net home equity shrank as a share of assets for these groups, while mortgage debt rose relative to house values—especially leading up to and through the Great Recession [4]. When housing prices collapsed, highly leveraged households suffered large wealth losses, and even as housing and equity prices later recovered, typical wealth at the middle barely returned to pre-crisis levels because of debt overhang and dissaving [4]. By contrast, top wealth holders hold diversified portfolios dominated by equities and business stakes, with relatively lower leverage. They thus capture outsized gains during asset price booms and are better shielded during busts [2][4]. Over time, repeated boom–bust cycles in housing and equity markets have reinforced this asymmetry, further concentrating wealth.
These aggregate patterns are deeply racialized. Despite advances in civil rights and education, racial wealth gaps have remained extraordinarily large. In 2022, the median white household held about $284,000–$285,000 in wealth, over six times the roughly $44,000–$44,900 held by the median Black household and about four times the approximately $61,600–$62,000 for the median Hispanic household; Asian families, first separately identified in 2022, had a median net worth around $536,000 [1][3]. Even within each group’s own upper tail, disparities persist: at the 90th percentile of wealth, Black and Hispanic households hold roughly $517,000–$518,000, compared with more than $2.5 million for similarly positioned white households—a nearly fivefold difference [2]. These figures make clear that rising aggregate wealth has not translated into convergence across racial groups.
Short-run improvements have not altered the long-run picture because starting points differ so starkly. Between 2019 and 2022, Black families’ median wealth rose by about 60%, the fastest growth of any group, yet because initial levels were so low, this translated into only a modest reduction in relative gaps [1]. Structural mechanisms explain why income gains do not close wealth disparities: for each additional dollar of income from 1984 to 2009, African American households accumulated only $0.69 in additional wealth, while white households accumulated about $5.19—over seven times more [1]. Higher initial wealth allows white families to buy into appreciating neighborhoods, invest in businesses and equities, and better withstand downturns, creating a compounding cycle of advantage.
Intergenerational transfers are a key channel through which these racialized disparities persist. New analyses of Survey of Consumer Finances data show that inheritances and inter vivos (lifetime) gifts are more frequent and substantially larger for white families than for Black or Hispanic families [4][5]. Because white households already hold more assets, they are able to pass on greater financial support for education, down payments, and business formation, thereby reinforcing their children’s wealth prospects. By contrast, Black and Hispanic families—who often rely more heavily on home equity and have less diversified portfolios—face greater exposure to discriminatory housing and credit markets and have fewer assets to transfer [3][5]. These interlocking dynamics of asset composition, discrimination, and unequal bequests help explain why racial wealth gaps have proven so resistant to change, even amid overall growth in top-end wealth.
Public perceptions lag far behind these realities. Surveys repeatedly find that Americans of all political backgrounds grossly underestimate the degree of wealth concentration and express preferences for a distribution far more equal than the current one [1]. Symbolic statistics—such as a handful of billionaires possessing more wealth than the bottom half of Americans—capture how far the U.S. has moved from the broadly shared postwar gains of the mid‑20th century. Since roughly 1976, tax, financial, labor, and housing institutions have combined with compounding asset-market asymmetries and entrenched racial disparities to produce a wealth distribution in which the top 1% now claims close to two-fifths of all wealth, the bottom half holds only a few percent, and racial and intergenerational divides remain profound.
Conclusion
Since the mid‑1970s, the evidence points in one direction: U.S. wealth has become markedly more concentrated at the top, though the exact numbers depend on how we measure them. Harmonized survey, tax, national accounts, and rich‑list data now broadly agree that the top 1% moved from roughly 25–30% of wealth to about 40%. Policy choices—especially tax, financial, and labor‑market changes—have amplified capital incomes and constrained asset‑building for most households. These shifts have unfolded through asset booms and busts that favored equity‑rich elites, while racialized gaps in homeownership, transfers, and returns to income compounded across generations, locking in a far more unequal wealth distribution.
Sources
[1] https://en.wikipedia.org/wiki/Wealth_inequality_in_the_United_States
[2] https://pmc.ncbi.nlm.nih.gov/articles/PMC5560613
[3] https://www.cbpp.org/research/poverty-and-inequality/a-guide-to-statistics-on-historical-trends-in-income-inequality
[4] https://bibbase.org/f/nKAPSyp34A9azBzJd/Battyetal2022wp.pdf
[5] https://wid.world/www-site/uploads/2020/10/WorldInequalityLab_WP2020_21_RevisingTheRevisionists.pdf
[6] https://www.nber.org/system/files/working_papers/w25462/w25462.pdf
[7] https://eml.berkeley.edu/~saez/SaezZucman14slides.pdf
[8] https://www.bostonfed.org/-/media/Documents/Workingpapers/PDF/2021/wp2106.pdf
[9] https://www.econstor.eu/bitstream/10419/238088/1/wp2106.pdf
[10] https://gabriel-zucman.eu/files/SaezZucman2016Slides.pdf
[11] https://equitablegrowth.org/the-federal-reserves-new-distributional-financial-accounts-provide-telling-data-on-growing-u-s-wealth-and-income-inequality
[12] https://ncrc.org/the-racial-wealth-gap-1992-to-2022
[13] https://www.urban.org/sites/default/files/2023-11/Intergenerational Wealth Transfers-Do Expectations of Leaving an Inheritance Differ Between Black and White Families.pdf
[14] https://www.bostonfed.org/-/media/Documents/Workingpapers/PDF/2023/cpp20230307.pdf
[15] https://www.levyinstitute.org/pubs/wp_502.pdf
[16] https://www.rsfjournal.org/content/2/6/24
Written by the Spirit of ’76 AI Research Assistant


Leave a comment