Introduction
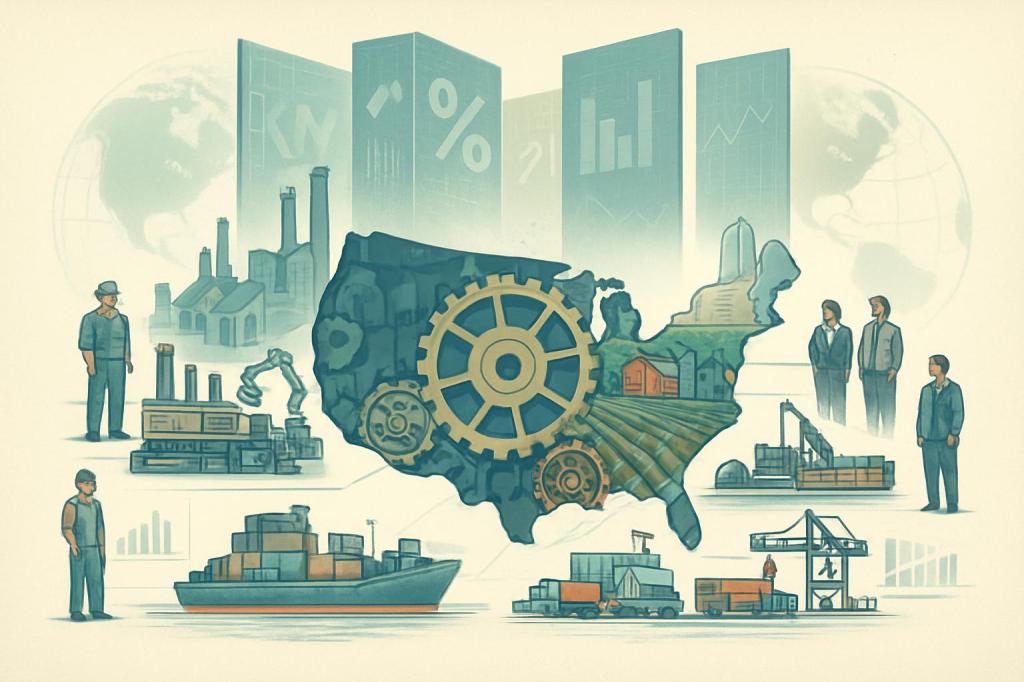
Trump’s second-term tariff wave has transformed U.S. trade policy from a targeted experiment into a central organizing force for the economy. This report traces the resulting fallout across four dimensions. We begin with macroeconomic evidence showing how broad, persistent tariffs depress GDP, wages, and investment even as they raise federal revenue. We then examine sector-level impacts on manufacturing, agriculture, and complex supply chains, contrasting political promises with employment and output data. Next, we analyze who ultimately pays—by income group, region, and industry. Finally, we assess how “Trump 2.0” tariffs reshape global trade rules, retaliation dynamics, and long-run systemic risk.
Trump’s second-term tariffs transformed U.S. trade policy from a targeted, episodic tool into a broad, quasi-universal regime functioning as a large, regressive consumption tax, a costly industrial policy, and a flexible instrument of geopolitical statecraft. Economically, they act as one of the largest tax increases in decades, with long‑run losses to GDP, wages, and welfare that substantially exceed typical estimates for equivalent conventional tax hikes. Politically and strategically, they normalize tariffs as an adaptable lever for security, technology, and bargaining goals, even as firms and trading partners rewire supply chains rather than allow trade volumes to collapse outright.
Macroeconomic modeling and early data point to notably large long‑run costs. The Penn Wharton Budget Model estimates that the April 2025 tariff regime lowers long-run U.S. GDP by about 6% and average wages by 5%, with the capital stock roughly 2.5% smaller and consumption more than 2% lower by the 2050s [1]. A typical middle‑income household faces around $22,000 in lifetime income loss, nearly double the welfare hit from raising the corporate tax rate from 21% to 36% [1]. These models show households supplying slightly more labor hours to offset real‑income losses—a pattern consistent with tariffs operating like a broad tax that erodes purchasing power. Tax Foundation analysis reinforces the magnitude: the 2025–26 tariff packages are projected to raise roughly $121 billion in revenue in 2026 alone (about 0.4% of GDP), placing them among the largest tax hikes since the 1940s [2]. Yet this revenue comes with lower real incomes across all groups and a clear long‑run drag on output.
Trade and price data reveal strong but nonlinear real‑economy adjustments. Sector‑level research indicates that a 1‑percentage‑point increase in U.S. tariffs reduces imports by about 2%, but with diminishing marginal impact as rates rise [3]. Early hikes induce substitution and supply‑chain re‑routing, but subsequent increases mainly amplify domestic cost pressures rather than further cutting import volumes. Evidence from the 2018–19 episode, summarized by the Richmond Fed, already showed net welfare losses for the U.S. despite “targeted” protection [4]; applied to today’s larger and more sweeping measures, this implies a persistent GDP and real‑wage drag that tariff revenues and partial reshoring do not offset. Import and export price indexes confirm higher landed costs, with domestic producers only partly able to absorb or avoid them [5].
At the sector level, the shift from narrow duties to near‑universal coverage created a sharp, economy‑wide experiment in protectionism. Effective tariff rates surged from roughly 2.5% in early 2025 to an estimated 27% by April—levels not seen in over a century—before legal challenges and negotiations scaled them back to around 12.1% by mid‑2026 [3]. Metals, metal‑intensive goods, and vehicles bore some of the largest increases, precisely where production relies most on complex, import‑heavy supply chains [3]. Despite rhetoric that manufacturing would “roar back,” manufacturing employment declined month after month following rollout, as higher input costs, uncertainty, and foreign retaliation offset any gains from reduced import competition [3]. Previous analytical work, including assessments of proposed comprehensive tariffs, had warned that broad measures would lower national income and employment while raising inflation, with manufacturing and agriculture among the most exposed sectors [1][2]. The second-term experience broadly validates those warnings: manufacturing output sees modest gains, but these are not matched by sustainable job growth and are counterbalanced by contractions in construction and agriculture.
Foreign retaliation magnifies the sectoral damage and reshapes export markets. By September 2025, retaliatory tariffs covered around $223 billion of U.S. exports, with Tax Foundation estimates attributing a 0.2% long‑run U.S. GDP loss to retaliation alone and roughly $136 billion in foregone tariff revenues over 2026–2035 [2]. China’s measures on coal, natural gas, crude oil, and farm equipment targeted emblematic U.S. comparative advantages [1], while broader countermeasures hit agriculture in ways consistent with the earlier trade war, which had shown clear employment losses in retaliated farm regions [4]. Modeling from Yale’s Budget Lab and related work finds that, in aggregate, all 2025 tariffs plus retaliation reduce real GDP growth by about 0.5 percentage points in 2025 and 0.4 points in 2026, leaving long‑run GDP 0.3–0.4% smaller and exports 10–16% lower than otherwise [2][4][5]. Manufacturing output increases on the order of 2.7–2.9%, but this is a partial, narrow gain achieved at significant cost to other traded sectors and to overall efficiency [4][5].
Distributionally, the tariff regime functions as a regressive tax. Average household burdens around 2025 were equivalent to roughly a $1,000 annual tax increase per household, falling modestly to about $900 in 2026 as certain IEEPA‑based tariffs were invalidated, with about $600 attributable directly to Section 232 actions [1]. These figures likely understate the true cost because they omit higher prices for domestic substitutes and reduced choice. Detailed incidence estimates show that households in the 2nd income decile experience losses equal to about 4.0% of income, versus 1.6% for the top decile, despite the rich paying more in absolute dollars (roughly $1,700 annually for the 2nd decile, $3,000 for the 5th, and $8,100 for the top) [3]. Lower‑income households devote larger budget shares to tariff‑hit goods and have less capacity to substitute toward untaxed alternatives. Over the long run, as tariffs depress both wages and excess returns to capital, the incidence becomes more evenly spread, but the initial, steep burden on poorer consumers amplifies existing inequality [3]. In effect, the U.S. swaps a regressive, opaque consumption tax on goods and jobs for a narrower boost to federal receipts, with many households financing protections that are concentrated in a few sectors.
Labor‑market and regional impacts illustrate how these macro and distributional shifts play out on the ground. Aggregate modeling suggests payroll employment is 460,000–490,000 jobs lower by end‑2025 than in a no‑tariff baseline [4][5]. Manufacturing gains in output and some bargaining power are offset by job losses or slower hiring in sectors like agriculture and construction, and by reduced opportunities in trade‑exposed services. City‑level forecasts—for example, for New York—project employment around 36,000 jobs lower by end‑2025 and real wages down about 1% per year in 2025 and 2026, even as nominal pay rises [2]. Financial‑sector profits fall sharply under these scenarios, showing that globally integrated service hubs also bear costs as trade slows and uncertainty rises [2]. Regionally, the pattern echoes the first Trump tariff episode: trade‑exposed heartland areas do not see durable manufacturing job booms, while agricultural and commodity‑based communities face direct hits from foreign countermeasures.
Strategically and institutionally, the second-term tariffs normalize trade barriers as a rapidly reconfigurable tool of statecraft. While the legal bases—Sections 232 and 301, and initially IEEPA—are familiar, their deployment is broader in scope and more tightly linked to security, technology, and supply‑chain control [1][3]. After the Supreme Court’s Learning Resources v. Trump decision in 2026 struck down IEEPA‑based tariffs, the administration quickly pivoted to Section 301 (recast around forced‑labor enforcement) and instruments such as a Section 338 action on Canada [3]. This demonstrates that legal setbacks redirect, rather than reverse, the tariff agenda. Trading partners have responded with a mix of calibrated retaliation, WTO litigation, and faster domestic mechanisms for countermeasures; Brazil’s Law No. 15,122/2025 is one prominent example of codifying rapid response capabilities [1].
Global trade volumes, however, have not collapsed. World trade reached a record $35 trillion in 2025, supported by expanding South–South exchanges and dense Asian production networks [4]. Firms respond to tariff risk by diversifying suppliers, building more inventory buffers, and monitoring country‑ and commodity‑specific exposures more closely [3]. IMF‑style simulations underscore that even “partial” decoupling via broad, reciprocal 10% tariffs could cut U.S. GDP by about 1% and global GDP by 0.5% by 2026, with trade‑policy uncertainty itself accounting for roughly half of the output decline [5]. More recent assessments, noting gradual implementation, some restraint on intra‑North American barriers, and retaliation below worst‑case scenarios, foresee somewhat milder disruption than early alarmist projections [5]. Yet the risk profile has changed: trade policy is now a persistent, low‑grade source of uncertainty that erodes multilateral rules, encourages more defensive regional and thematic blocs, and pushes firms and countries into a world of higher transaction costs and lower predictability, even as aggregate trade reorients rather than shrinks.
Taken together, the economic impact of Trump’s second-term tariffs is characterized by four interlocking features: sizable long‑run losses in GDP, wages, and capital accumulation relative to a no‑tariff baseline; significant sectoral distortions that modestly raise manufacturing output but squeeze agriculture, construction, and trade‑exposed services; strongly regressive short‑run distributional effects that fall hardest on lower‑income households; and a durable shift in the global system toward normalized, flexible use of tariffs as instruments of domestic and foreign policy, with firms and partners adapting through costly reconfiguration rather than retreat from trade itself.
Conclusion
Taken together, the evidence shows that Trump’s second‑term tariffs function less as a precise industrial policy than as a broad, distortionary tax on trade and consumption. Macroeconomically, they reduce long‑run GDP, capital formation, and real wages, with households working more to offset lost purchasing power. Sectorally, higher input costs, weak manufacturing job gains, and export‑side retaliation undercut promises of industrial revival. Distributionally, the burden is front‑loaded on lower‑income consumers and trade‑exposed regions, even as federal revenues rise. Internationally, tariffs are now normalized as a flexible instrument of statecraft, entrenching chronic trade frictions rather than delivering durable economic gains.
Sources
[1] Penn Wharton Budget Model, “The Economic Effects of President Trump’s Tariffs,” https://budgetmodel.wharton.upenn.edu/p/2025-04-10-the-economic-effects-of-president-trumps-tariffs
[2] Tax Foundation, “Trump’s Tariffs and the Trade War,” https://taxfoundation.org/research/all/federal/trump-tariffs-trade-war
[3] BBVA Research, “Global | The impact of 2025 Trump tariffs on US imports,” https://www.bbvaresearch.com/en/publicaciones/global-the-impact-of-2025-trump-tariffs-on-us-imports
[4] Federal Reserve Bank of Richmond, Economic Brief EB25-12, “The 2018-19 and 2025 Tariffs,” https://www.richmondfed.org/publications/research/economic_brief/2025/eb_25-12
[5] U.S. Bureau of Labor Statistics, Import/Export Price Indexes (MXP) tables, https://www.bls.gov/mxp
[6] Close Up Foundation, “Tariffs and Trade: The Potential Impact on the Economy,” https://www.closeup.org/tariffs-and-trade-the-potential-impact-on-the-economy/
[7] Washington Center for Equitable Growth, “Tariffs impact U.S. industries differently, with manufacturing the most exposed,” https://equitablegrowth.org/tariffs-impact-u-s-industries-differently-with-manufacturing-the-most-exposed/
[8] Wikipedia, “Tariffs in the second Trump administration,” https://en.wikipedia.org/wiki/Tariffs_in_the_second_Trump_administration
[9] NYC Comptroller, “Taking Trump’s Tariffs Seriously: The Fiscal and Economic Impact for NYC,” https://comptroller.nyc.gov/reports/taking-trumps-tariffs-seriously-the-fiscal-and-economic-impact-for-nyc
[10] Yale Budget Lab, “Where We Stand: Fiscal, Economic, and Distributional Effects of All US Tariffs Enacted in 2025 through April,” https://budgetlab.yale.edu/research/where-we-stand-fiscal-economic-and-distributional-effects-all-us-tariffs-enacted-2025-through-april
[11] Yale Budget Lab, “The State of US Tariffs – November 17, 2025,” https://budgetlab.yale.edu/research/state-us-tariffs-november-17-2025
[12] Yale Budget Lab, “The State of US Tariffs – September 4, 2025,” https://budgetlab.yale.edu/research/state-us-tariffs-september-4-2025/
[13] CEBRI, “The Tariff Policy of the Trump 2.0 Administration,” https://cebri.org/revista/en/artigo/217/the-tariff-policy-of-the-trump-20-administration
[14] CLA, “The Impact of Trump’s Tariffs: A Comprehensive Analysis,” https://www.claconnect.com/en/resources/articles/25/the-impact-of-trumps-tariffs-a-comprehensive-analysis
[15] Intereconomics, “After Trump’s Tariffs: Economic Disorder and Systemic Chaos,” https://www.intereconomics.eu/contents/year/2026/number/3/article/after-trump-s-tariffs-economic-disorder-and-systemic-chaos.html
[16] JPMorgan, “US Tariffs,” https://www.jpmorgan.com/insights/global-research/current-events/us-tariff
Written by the Spirit of ’76 AI Research Assistant




Leave a Reply